How RightRoute Ranks Areas: The Data Behind the Scores
A transparent explainer of how RightRoute scores and ranks UK areas: what data goes in, how the algorithm works, and why it helps you make smarter property decisions.
RightRoute Team
· Data & Research
· 31 March 2026
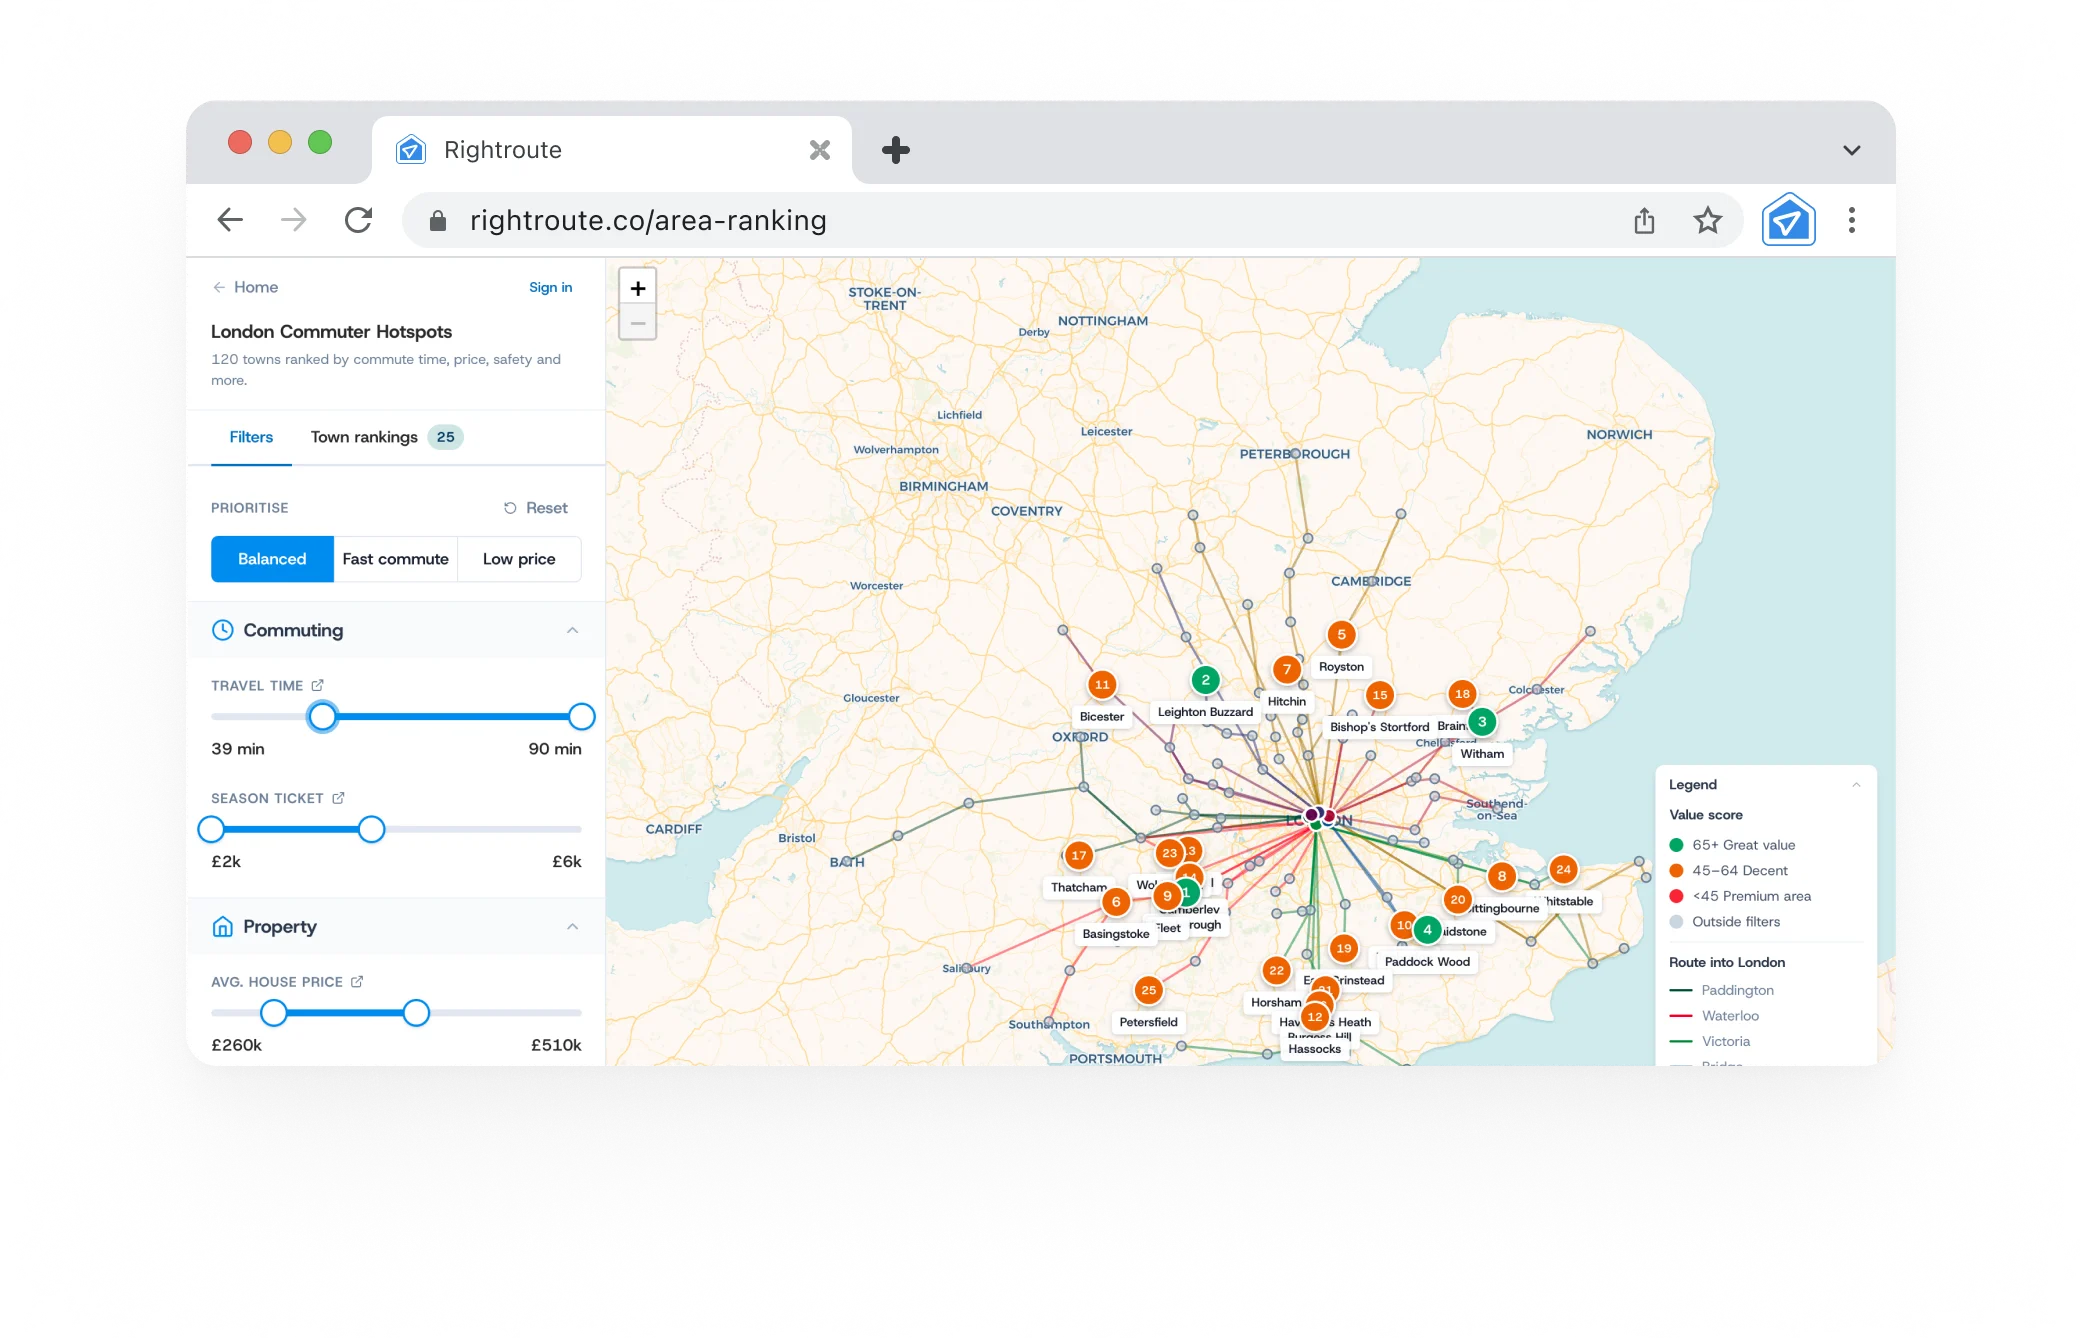
Most area-comparison tools are black boxes. They hand you a number out of 10 and leave you to guess what went into it. RightRoute works differently, so this post explains exactly what the scoring is based on, how the weighting works, and why you control the output.
The problem with generic rankings
The UK has plenty of "best places to live" lists. The Times does one every year. Rightmove, Zoopla, and MoveIQ all have versions. They're useful starting points, but they share a fundamental flaw: they weight every factor the same for every reader.
For a couple with two young children, school quality might be worth 40% of their decision. For a remote worker who visits the office twice a month, commute time is almost irrelevant. For a buyer at the edge of their budget, affordability is everything. A single universal ranking can't reflect those different priorities, which is why RightRoute lets you set the weighting yourself.
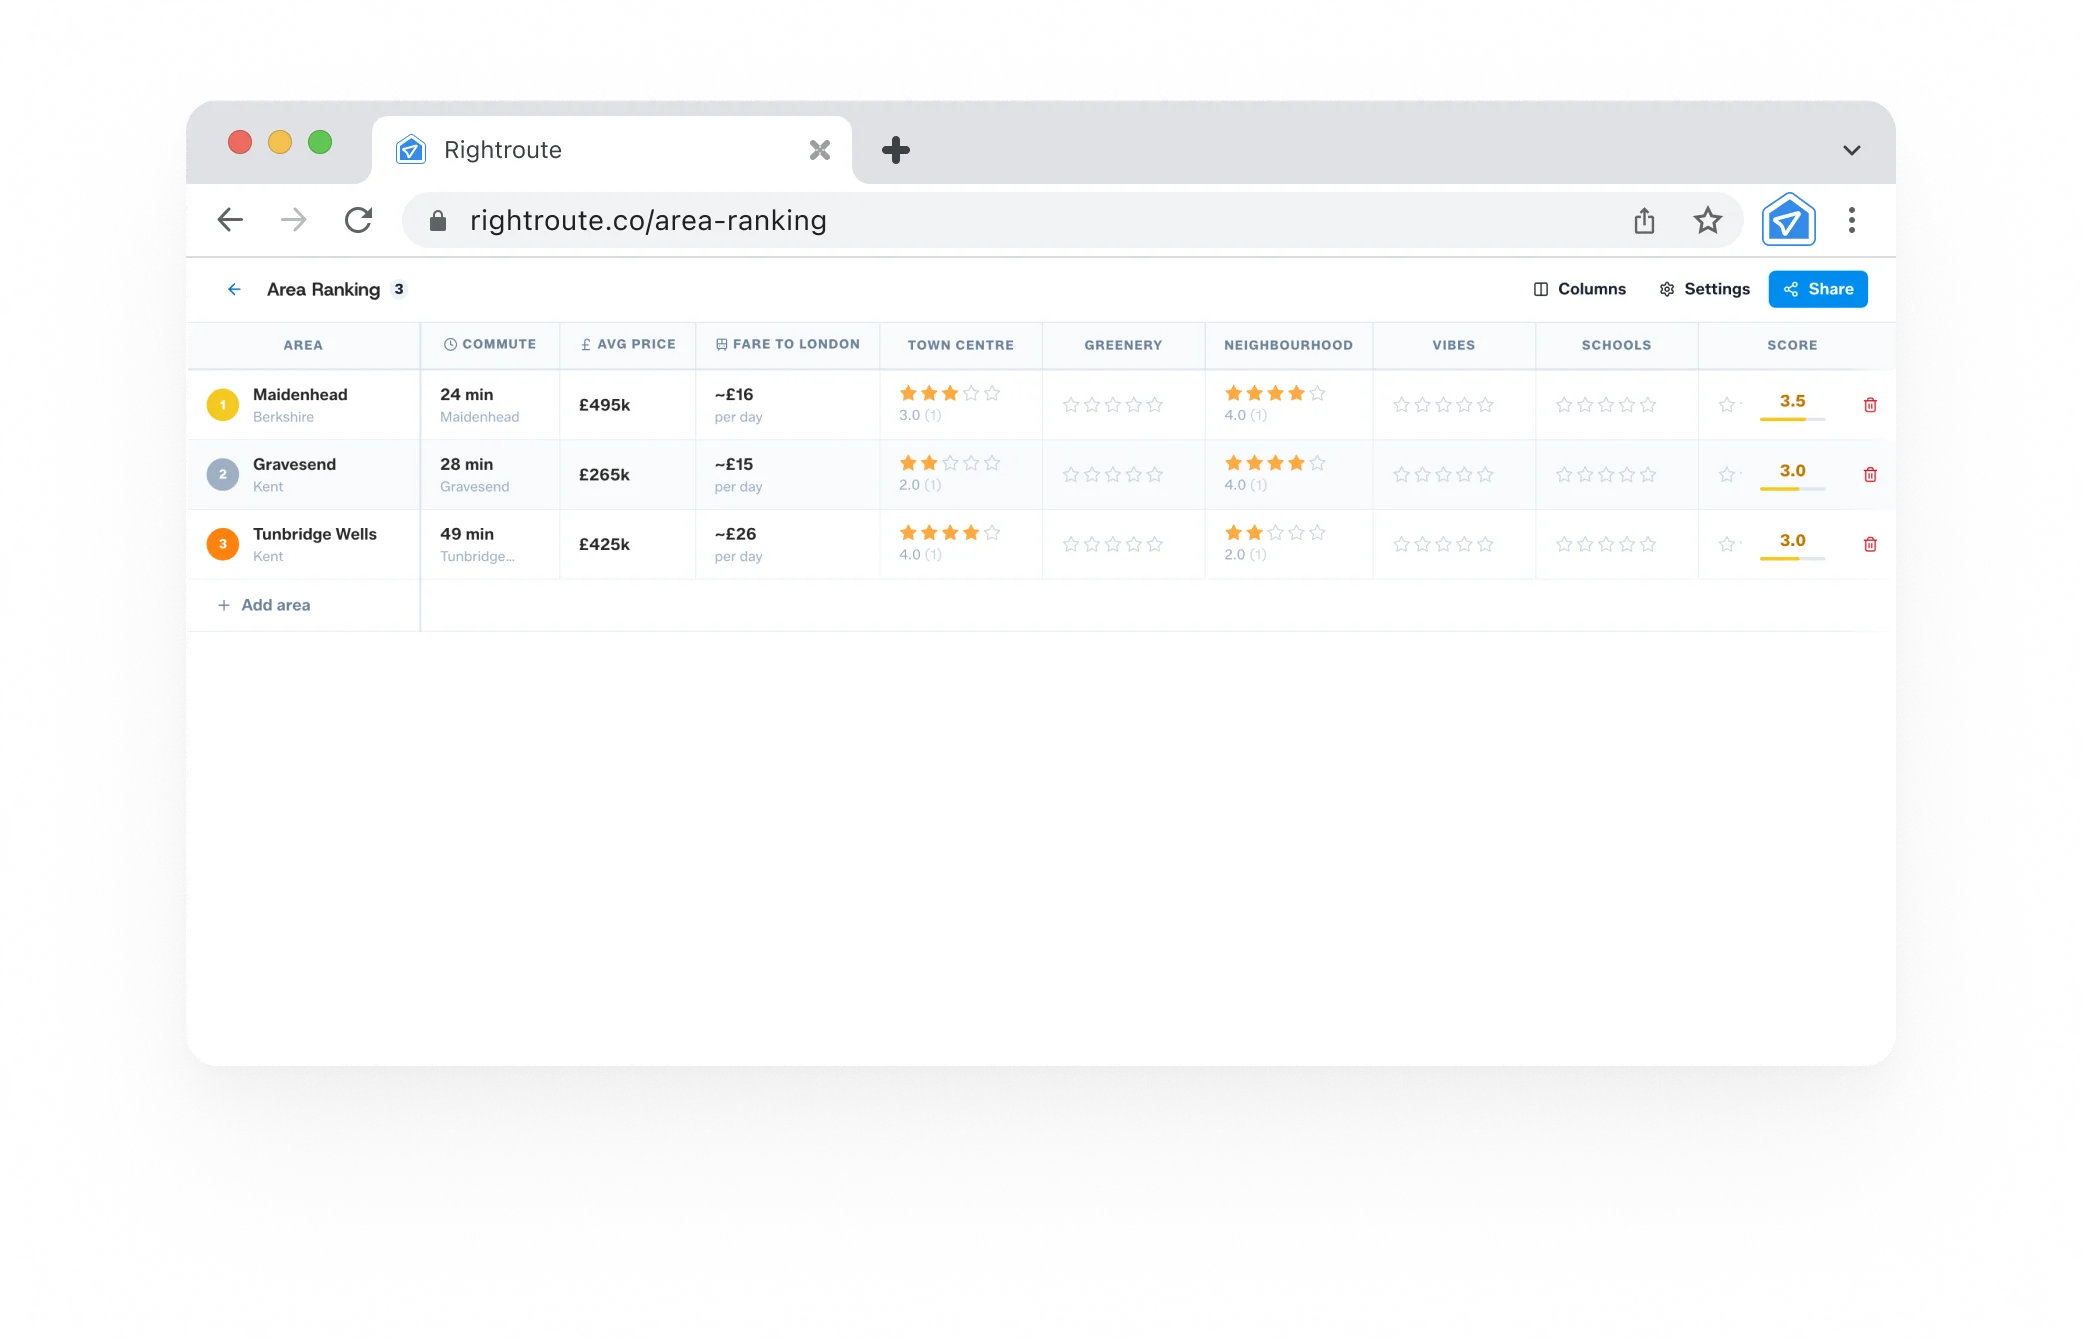
The seven scoring criteria
Every area in RightRoute is scored across seven dimensions. Here's what each one captures.
Commute
How long does it actually take to get to work, door to door? You set your destination and the tool accounts for journey time, service frequency, and whether the route is reliable or regularly disrupted. Peak-hour time only, because the off-peak figure isn't what matters on a Monday morning.
Average price
Median asking price for a three-bedroom semi in the area, updated regularly. The score is relative: a cheaper town scores higher. You can adjust the weighting based on how much affordability matters to your search.
Town centre
Is the high street alive or half-empty? This score reflects retail health, independent business density, food and drink options, and whether there's a market. It's an imperfect proxy for "quality of life on a Tuesday" but it's more useful than it sounds.
Greenery
Proportion of accessible green space within reasonable distance of the town centre, including parks, nature reserves, woodland, and riverside paths. Areas with good green space score better. Surprisingly useful filter for buyers who don't realise how much this matters until they're living somewhere without it.
Neighbourhood
A safety and liveability composite covering crime rates (weighted by category severity), resident satisfaction from ONS surveys, and housing stock condition. Reflects area-level averages, not specific streets, which is worth keeping in mind.
Vibes
The most subjective criterion and we're upfront about that. It pulls together community character signals: demographic mix, how long people tend to stay (a proxy for stability), number of community groups and events, and aggregated sentiment from local forums. It's trying to capture the intangible "feel" of a place that structured data can't fully get at.
Schools
Ofsted ratings for all state primaries and secondaries within 1.5 miles, weighted by proximity. An Outstanding primary at 0.4 miles scores higher than an Outstanding secondary at 1.4 miles. Progress 8 scores for secondaries and Key Stage 2 attainment for primaries are also factored in, so it reflects educational outcomes rather than just inspection grades.
How the weighting works
When you open RightRoute's rankings tool, you set a weight from 0 (doesn't matter) to 5 (critical) for each of the seven criteria. The tool calculates a weighted average score for each area using those weights.
This means two people comparing the same three towns can get completely different rankings because their priorities are different. That's the point. The score is meaningful to you, not to some notional average buyer.
What it doesn't do
Being transparent means being honest about limitations:
- It doesn't predict the future. House price trajectories and planned infrastructure aren't in the algorithm. A town with a low current price score might be the better long-term investment.
- It doesn't capture micro-variation. Two streets in the same town can have very different characters. The scores are area-level averages.
- It doesn't replace a visit. No data set captures the feeling of walking around on a Tuesday evening. Use the scores to shortlist; use your feet to decide.
Scoring with a partner
One thing RightRoute does that most area tools don't: collaborative ranking. Both people add the same areas, score them independently without seeing each other's ratings, then share the results.
This removes the anchoring problem where the first person to speak influences the second. Both people score based on their own priorities; the comparison reveals where you agree and where you'd need to compromise. In practice, it often surfaces disagreements that couples didn't know they had until they saw them side by side.
How to use it
- Go to rightroute.co/rankings.
- Add the areas you're considering (up to 10).
- Set your weighting for each of the seven criteria.
- Score each area, adjusting with your own knowledge where you have it.
- View ranked results and the breakdown by criterion.
- Share the link with a partner if you want to compare scores independently.
No account needed to get started. You only need to sign in if you want to save the ranking and come back to it later.
Explore area rankings for your next move: rightroute.co/rankings